パフォーマンスベンチマーク
このセクションではgprMaxのパフォーマンスベンチマークに関する情報と結果を示します。
ベンチマークの方法は?
単純なモデル (サブパッケージ内の tests/benchmarking ) を使用しあなた自身のシステム上で gprMax のベンチマークを実施できます。異なる領域サイズ (100^3 から 450^3 セル) で自由空間内に単純なヘルツダイポール(Hertzian dipole)ソースを配置したモデルです。以下に、100^3 セル モデルの例を示します。
1#domain: 0.1 0.1 0.1
2#dx_dy_dz: 0.001 0.001 0.001
3#time_window: 3e-9
4
5#waveform: gaussiandotnorm 1 900e6 MySource
6#hertzian_dipole: x 0.05 0.05 0.05 MySource
7#rx: 0.05 0.05 0.05
以下の手順により各モデルのベンチマーク結果を集めて報告します。
gprMaxをベンチマークモードで実行します。 例
python -m gprMax tests/benchmarking/bench_100x100x100.in -benchmarkUse the
plot_benchmarkmodule to create plots of the execution time and speed-up, e.g.python -m tests.benchmarking.plot_benchmark tests/benchmarking/bench_100x100x100.npz. You can combine results into a single plot, e.g. e.g.python -m tests.benchmarking.plot_benchmark tests/benchmarking/bench_100x100x100.npz --otherresults tests/benchmarking/bench_150x150x150.npz.あなたのデータを共有する場合はNumPyアーカイブファイルとプロットファイルを info@gprmax.com までメールで送付してください。
結果: CPU
Mac OS X
iMac15,1
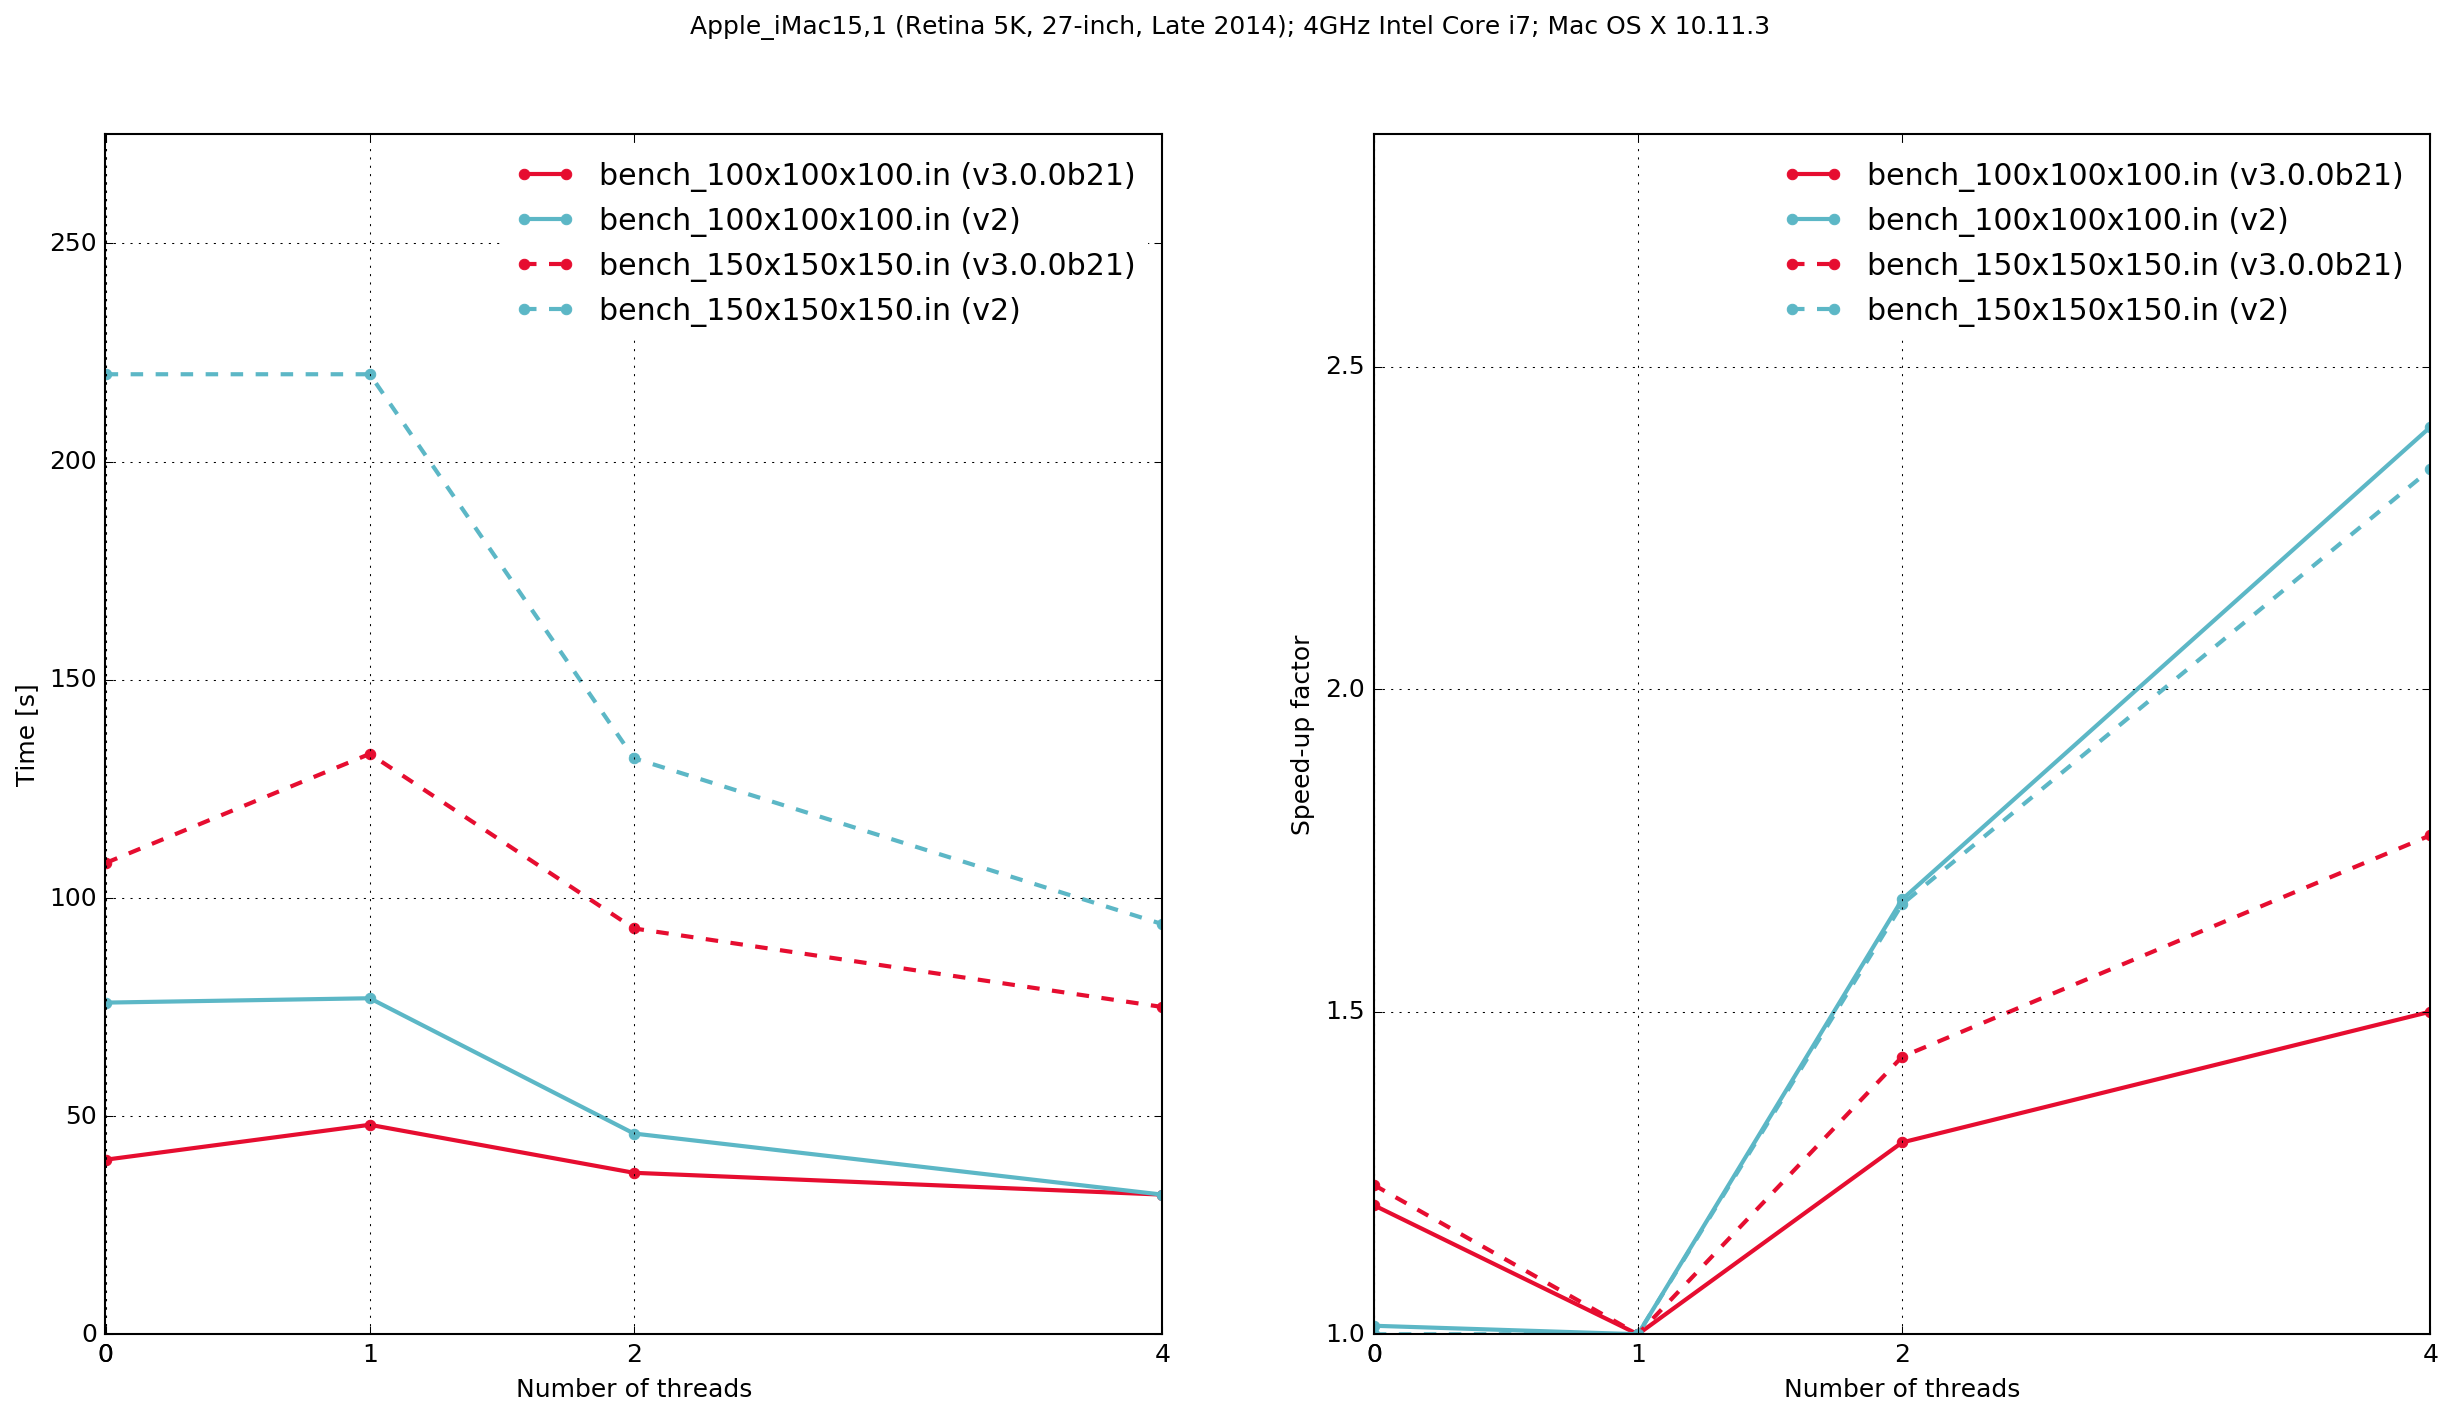
図 49 Execution time and speed-up factor plots for Python/Cython-based gprMax and previous (v.2) C-based code.
注釈
Zero threads indicates that the code was compiled serially, i.e. without using OpenMP.
The results demonstrate that the Python/Cython-based code is faster, in these two benchmarks, than the previous version which was written in C. It also shows that the performance scaling with multiple OpenMP threads is better with the C-based code. Results from the C-based code show that when it is compiled serially the performance is approximately the same as when it is compiled with OpenMP and run with a single thread. With the Python/Cython-based code this is not the case. The overhead in setting up and tearing down the OpenMP threads means that for a single thread the performance is worse than the serially-compiled version.
iMac15,1
MacPro1,1
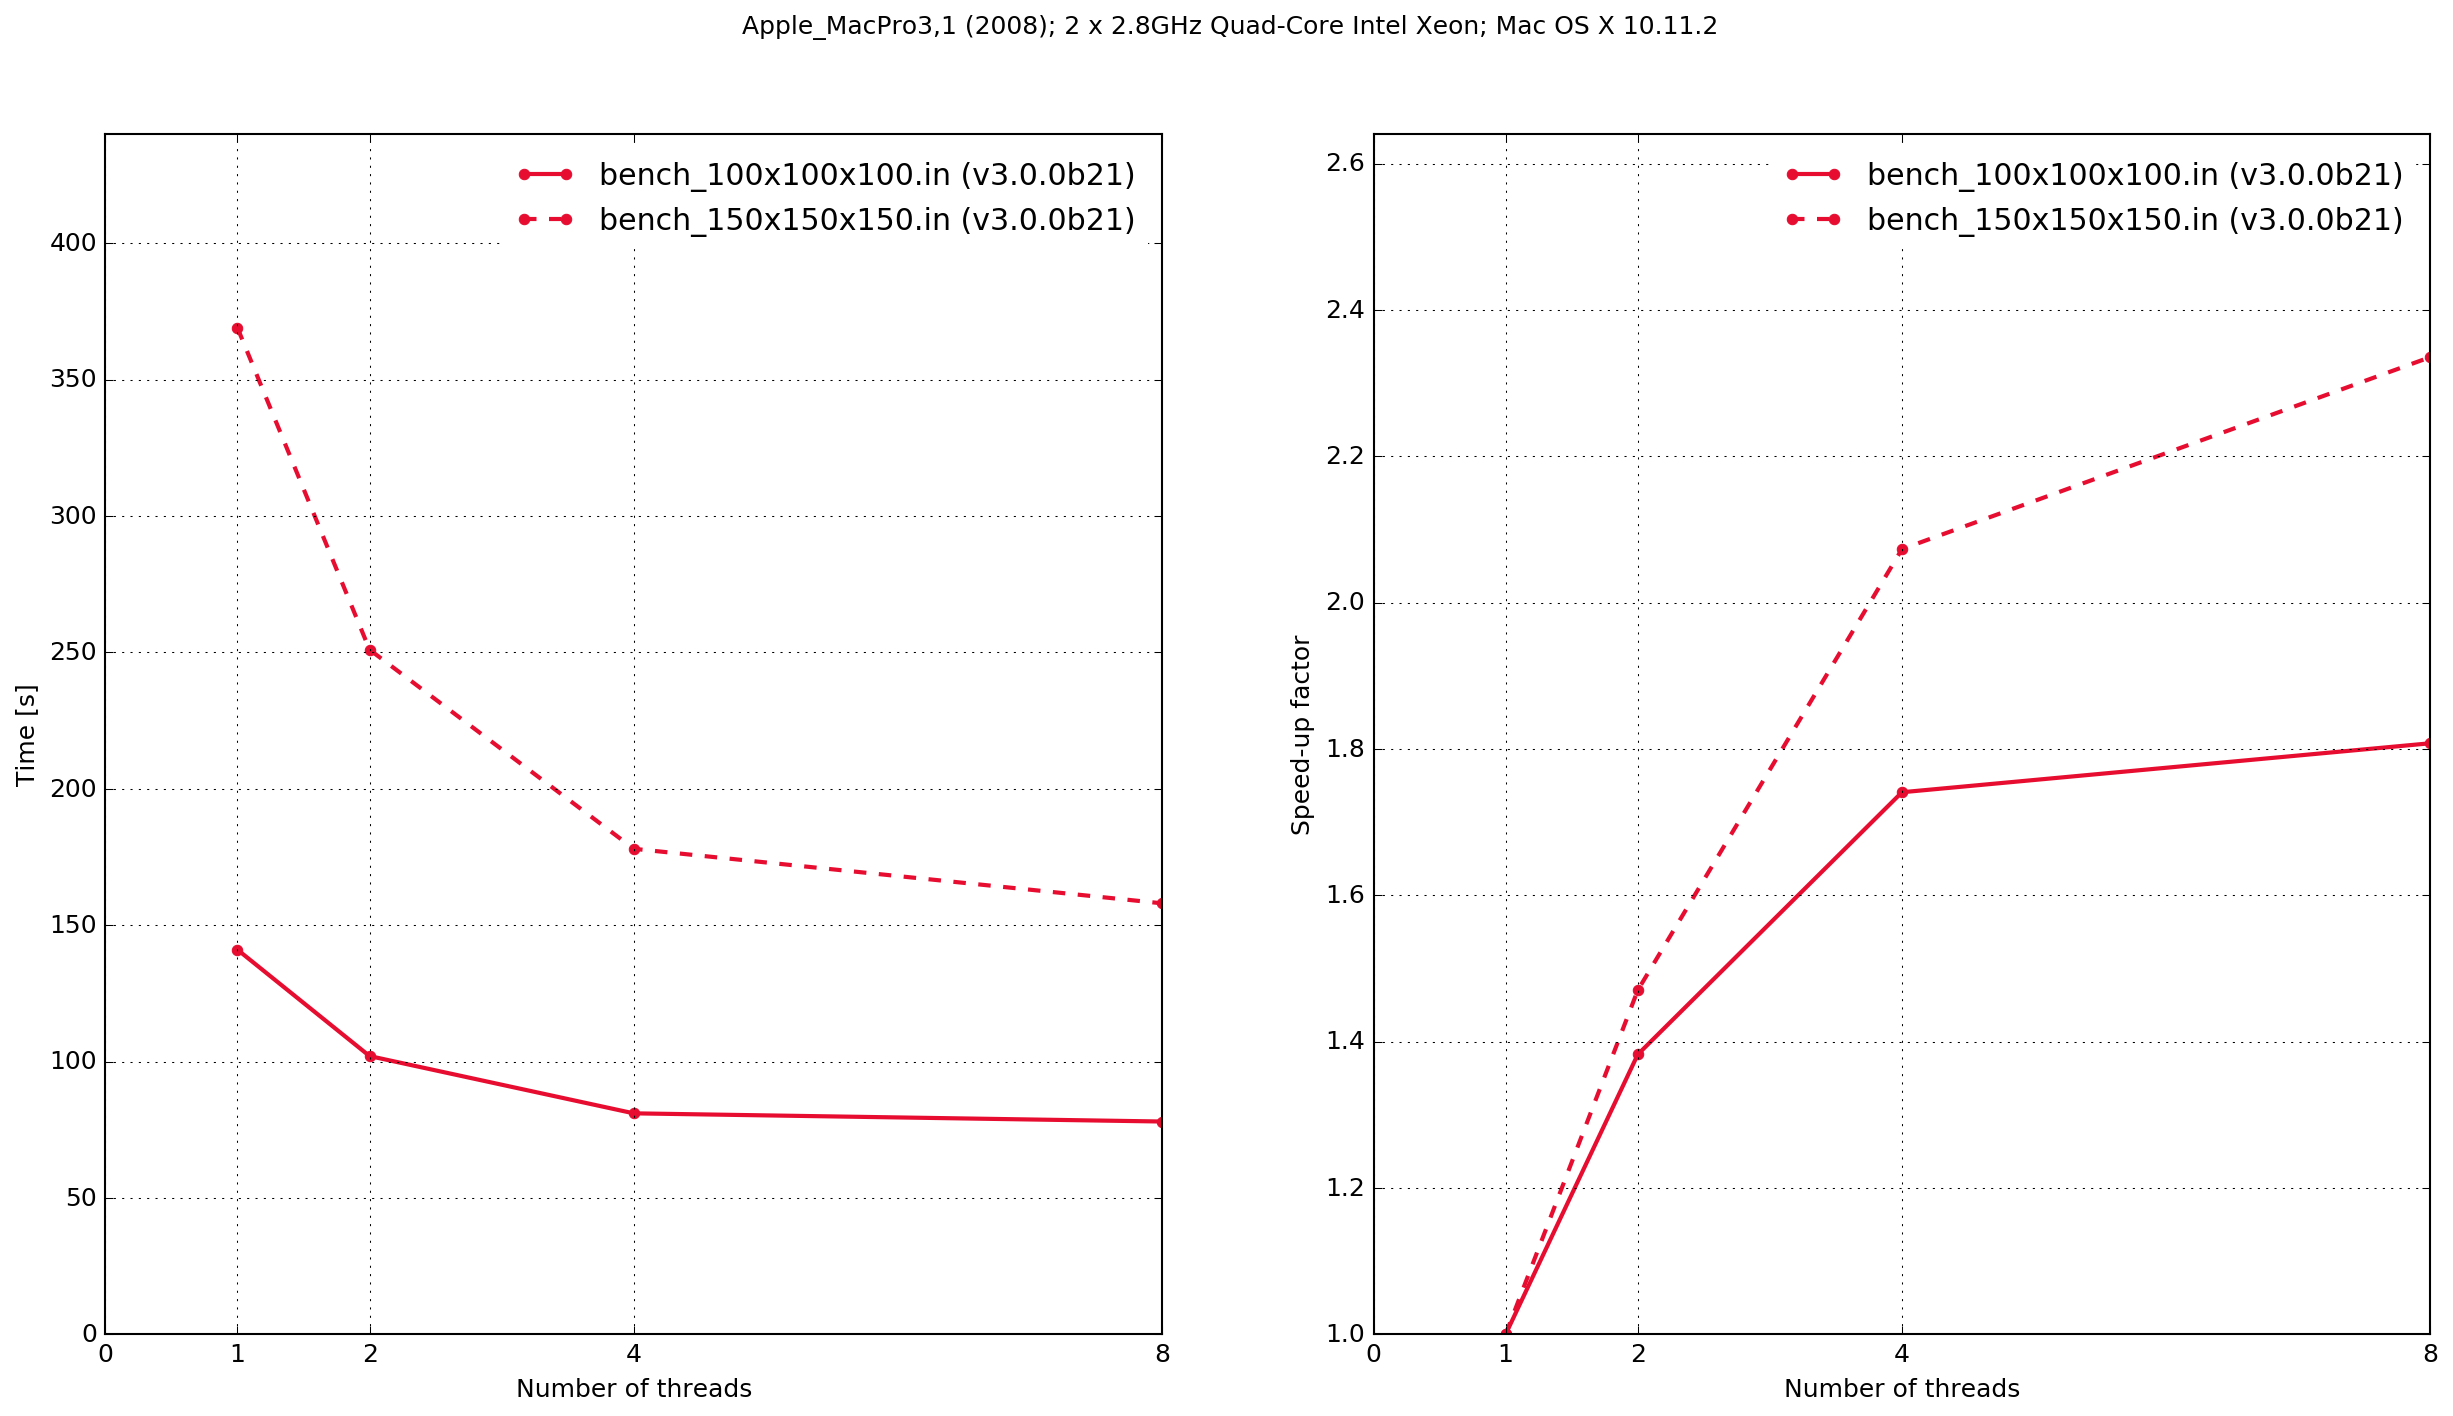
MacPro3,1
Linux
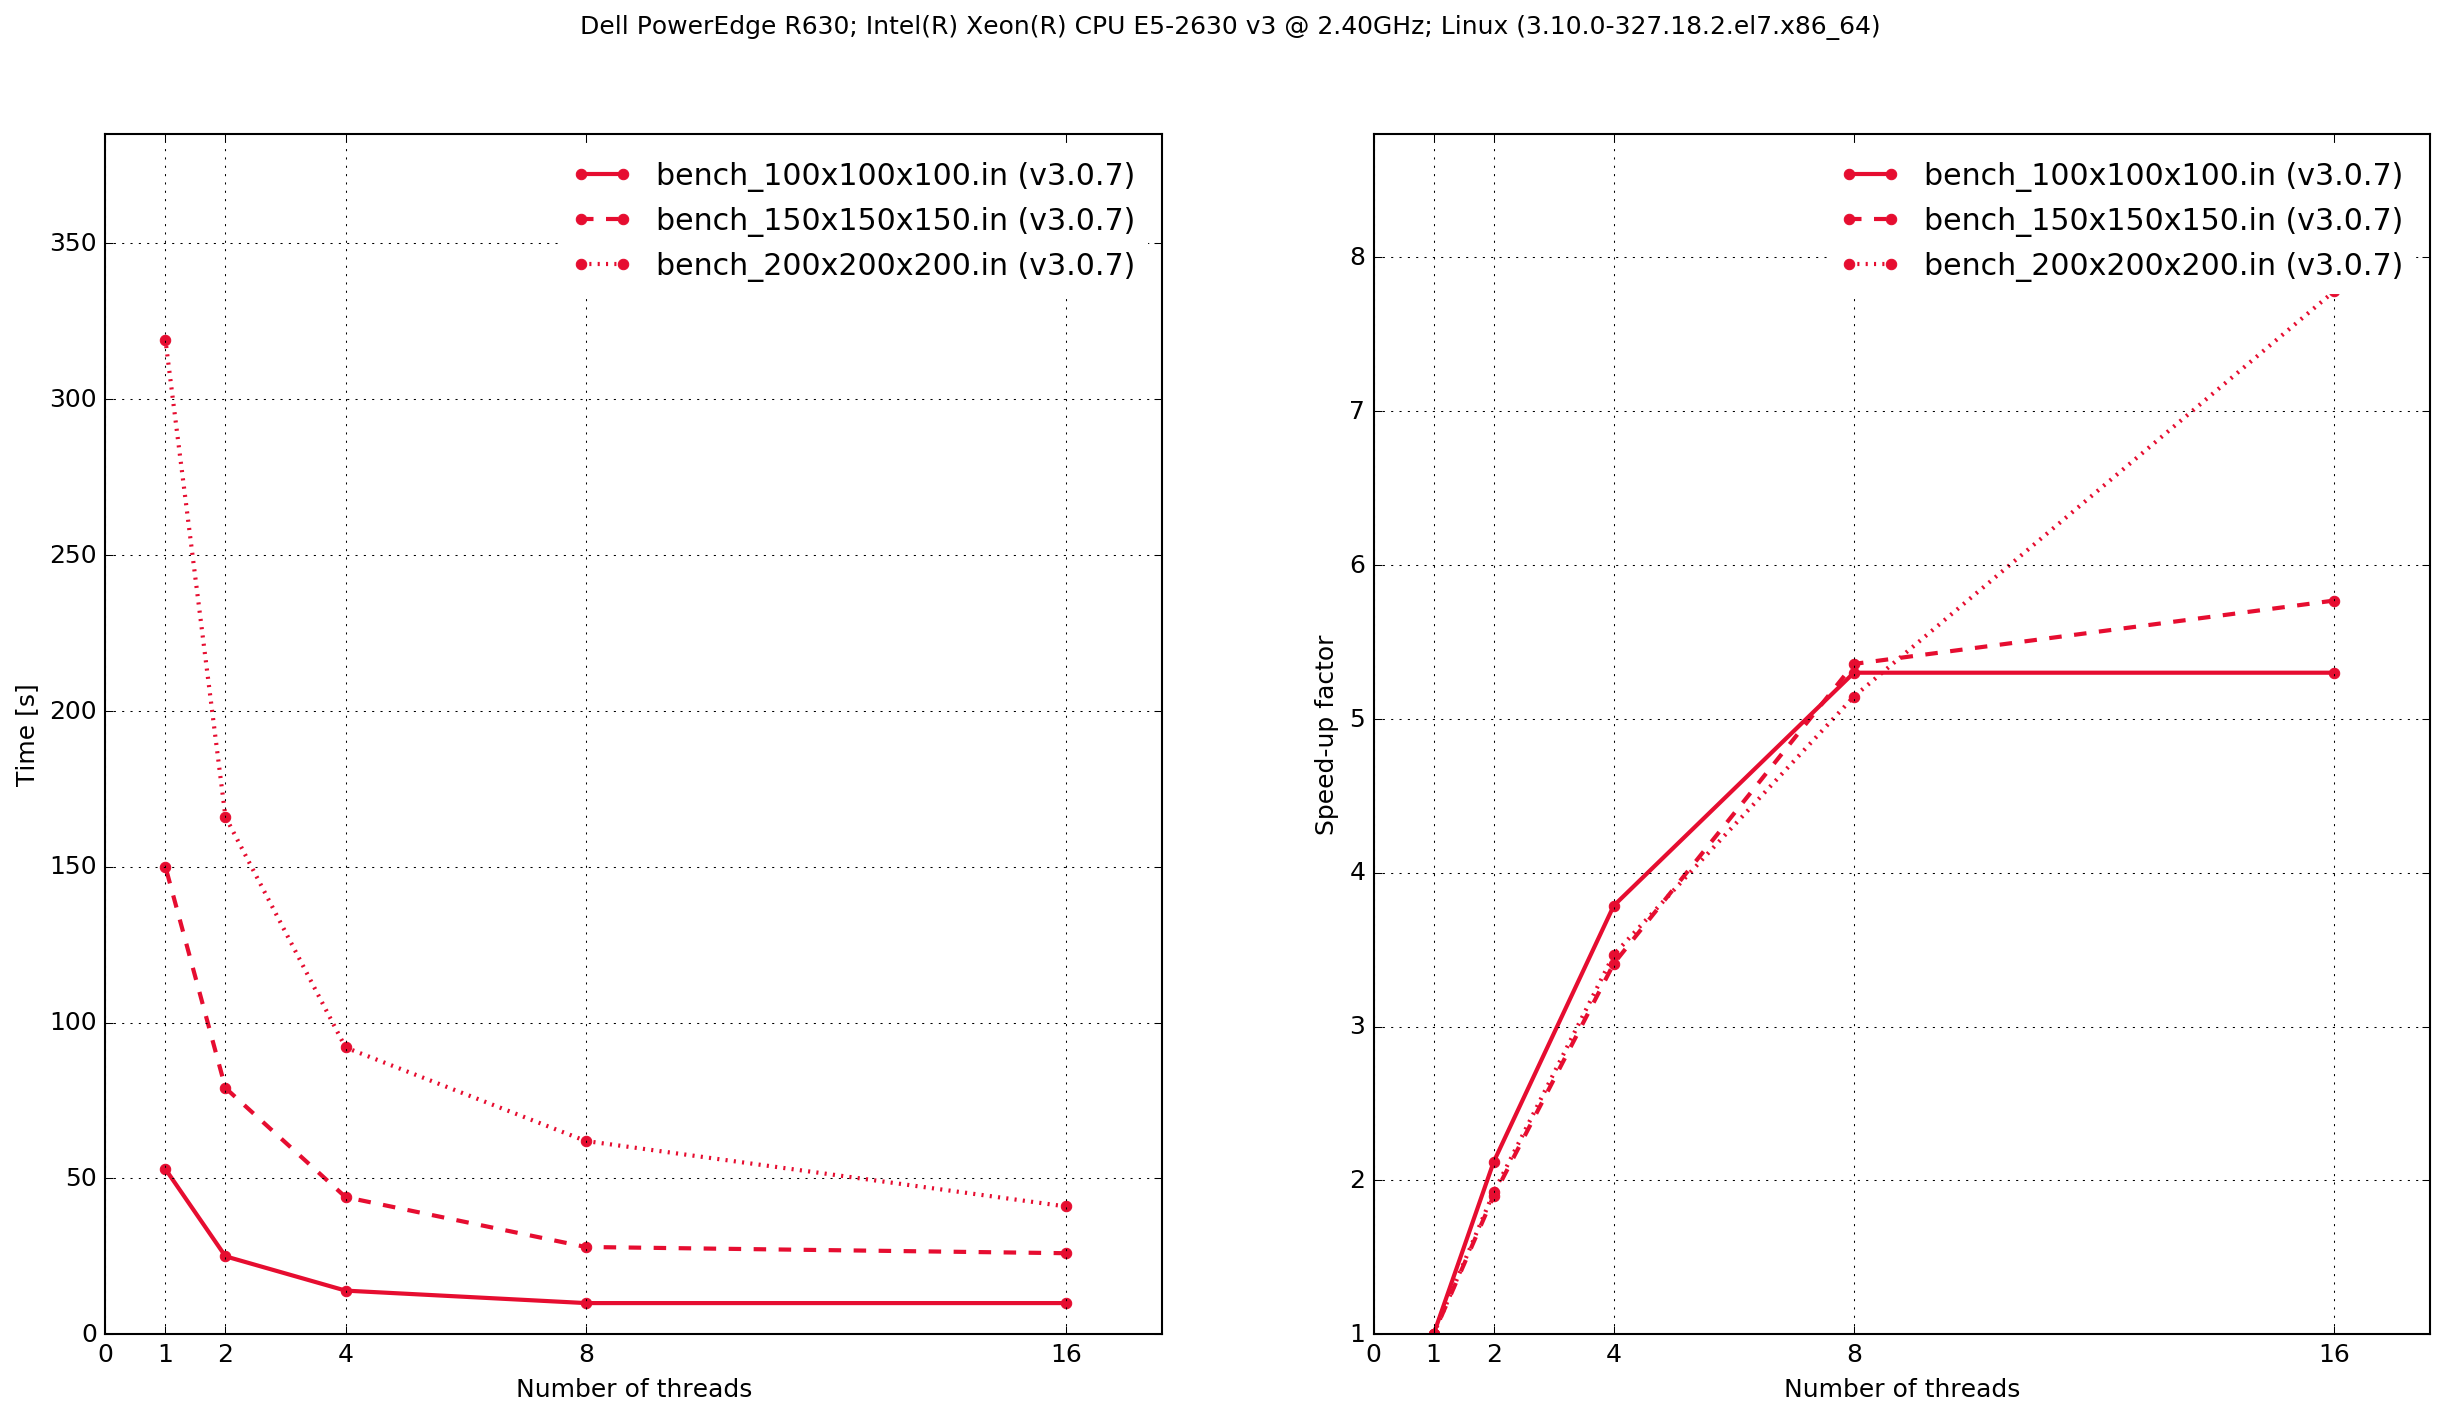
Dell PowerEdge R630
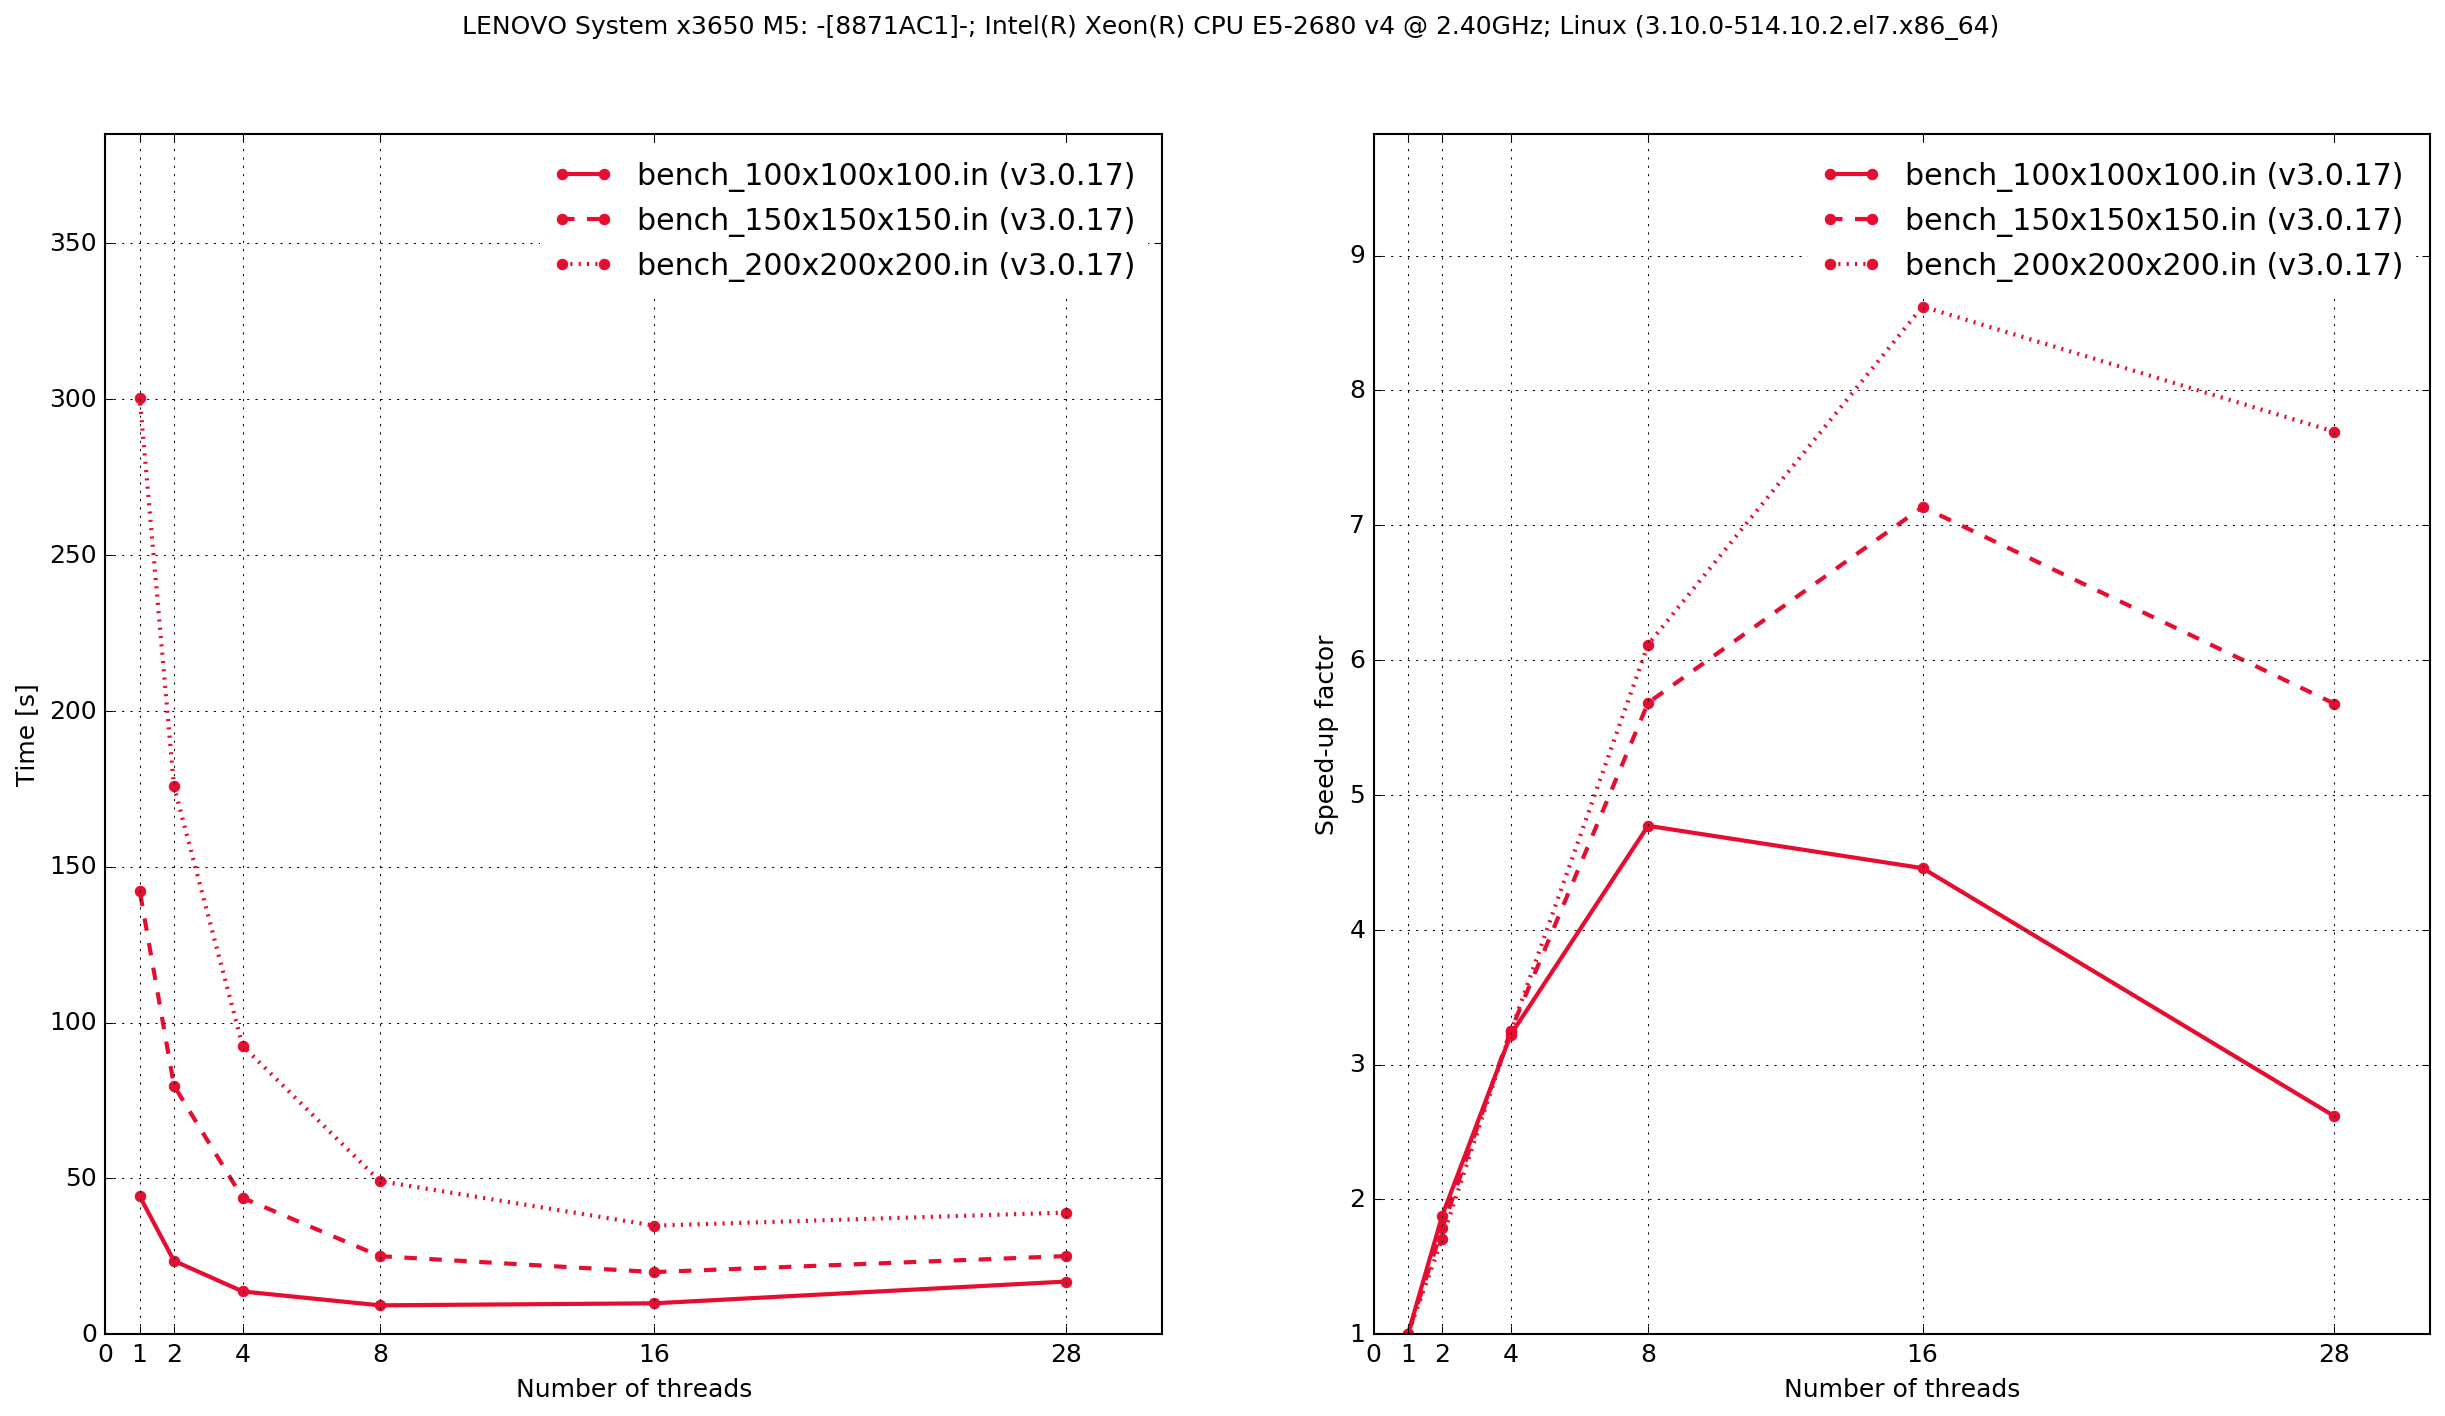
Lenovo System x3650 M5
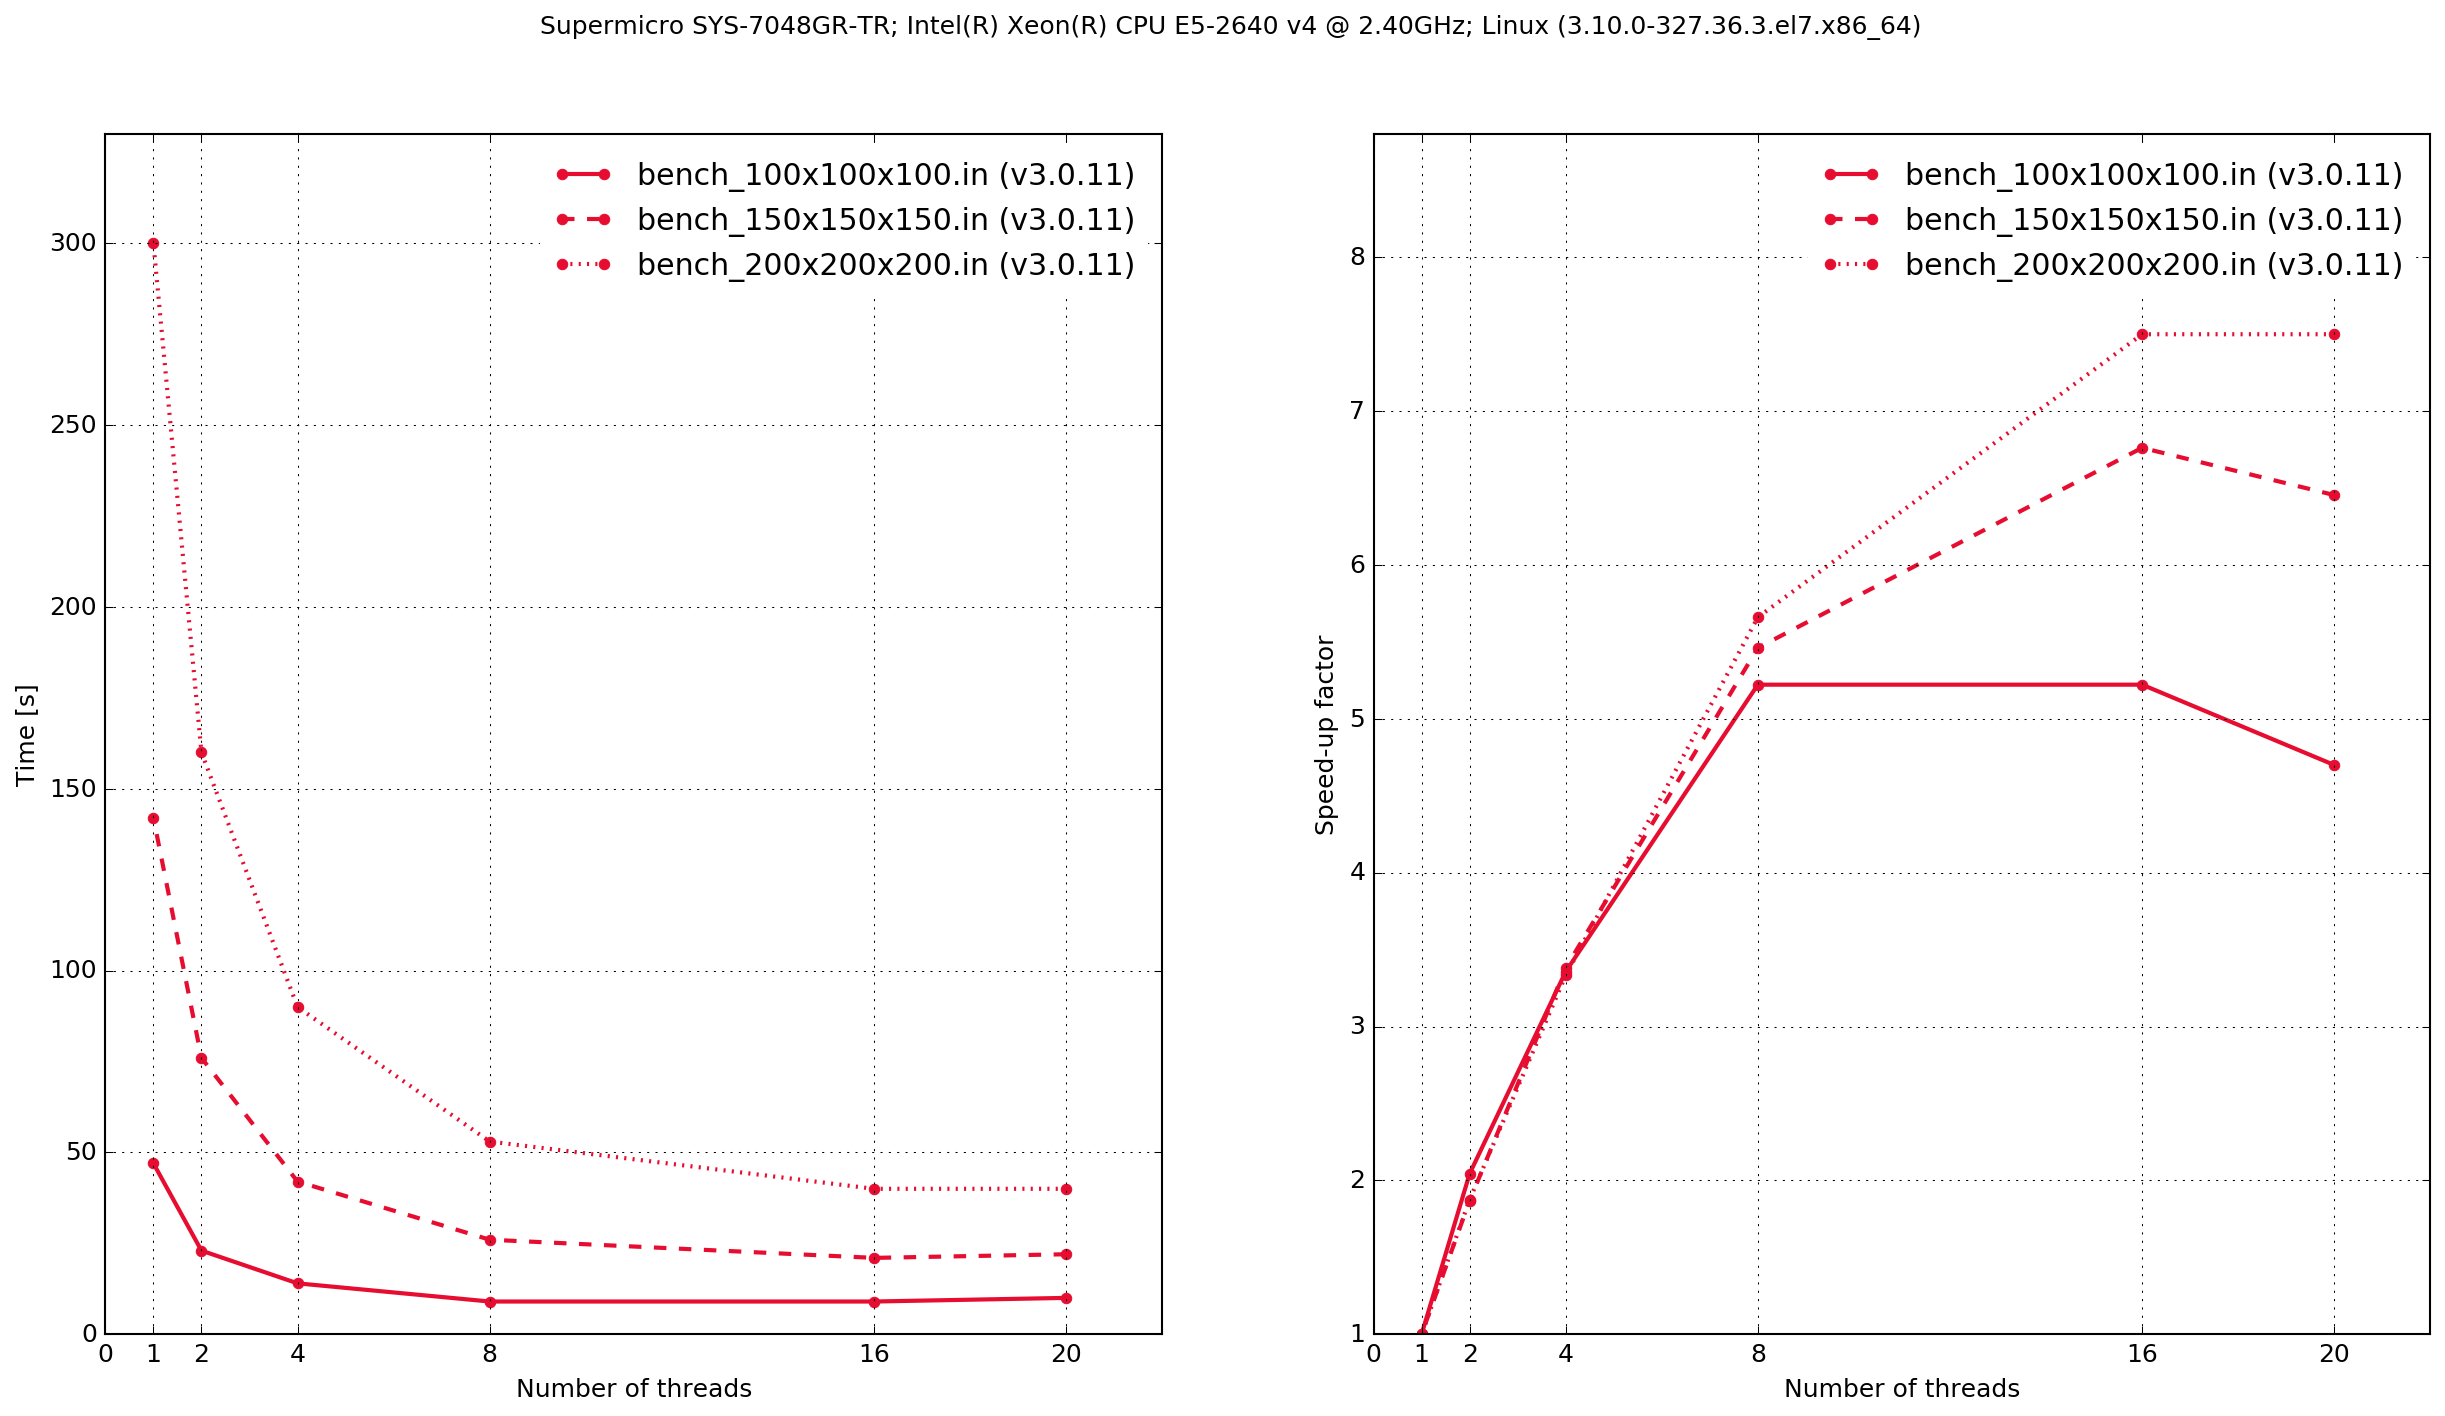
SuperMicro SYS-7048GR-TR
Windows
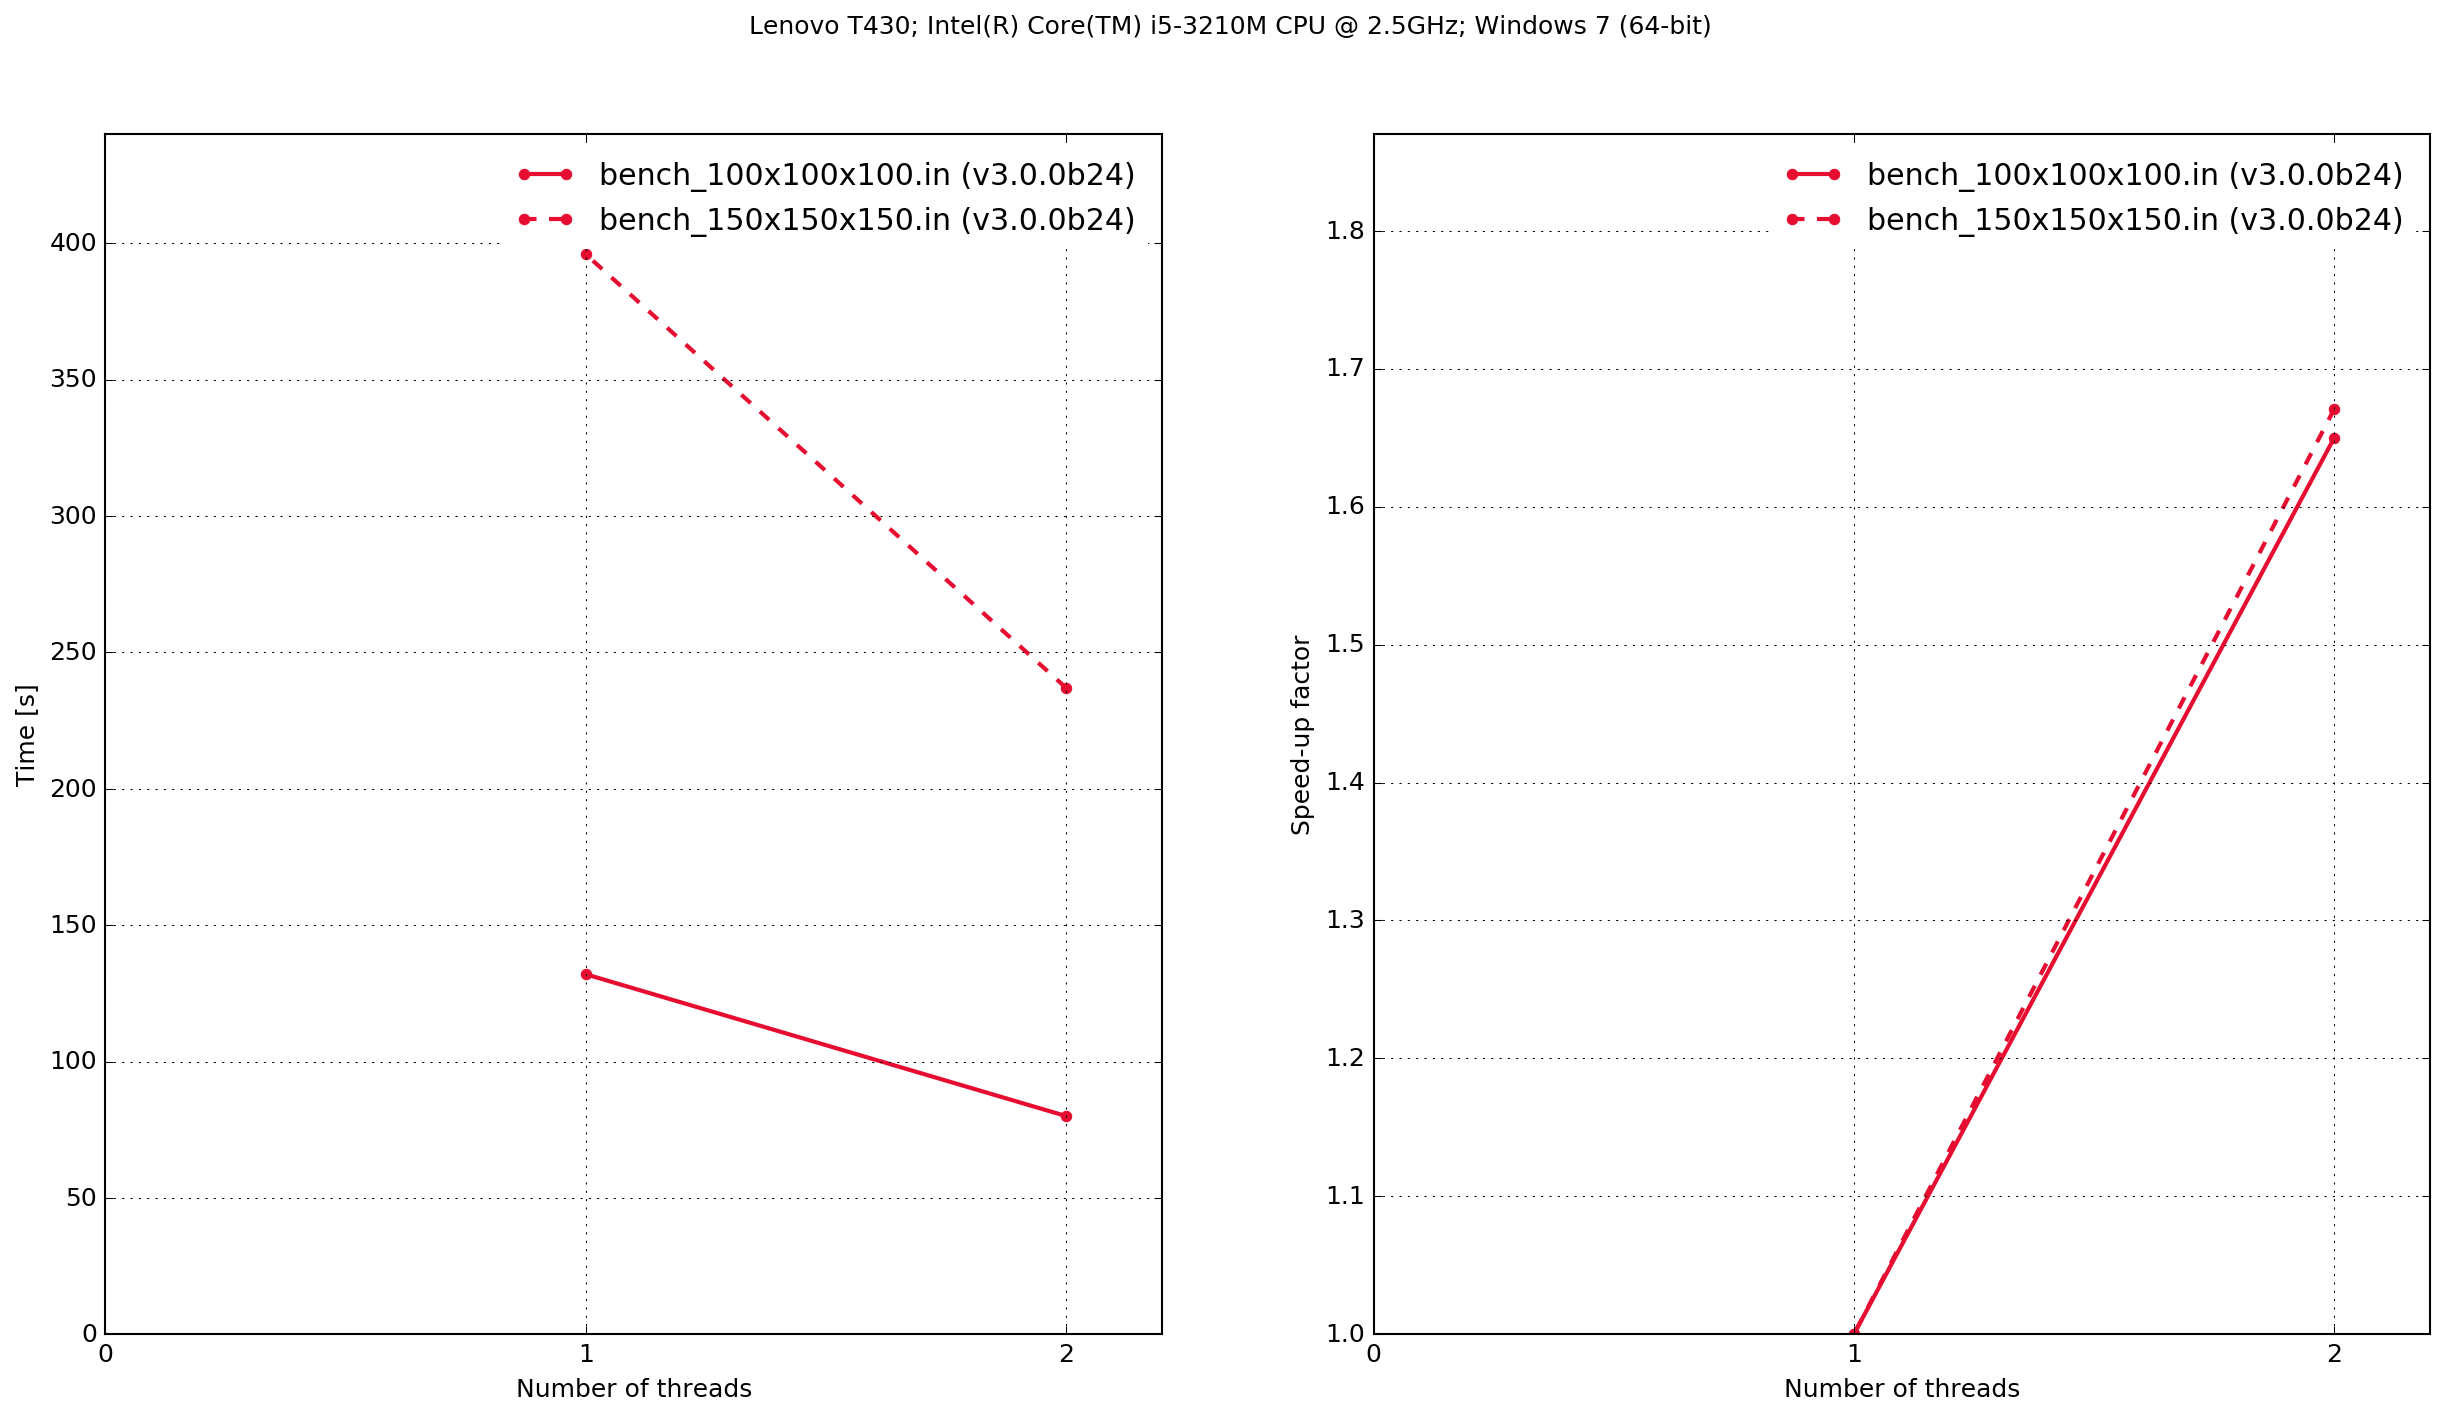
Lenovo T430
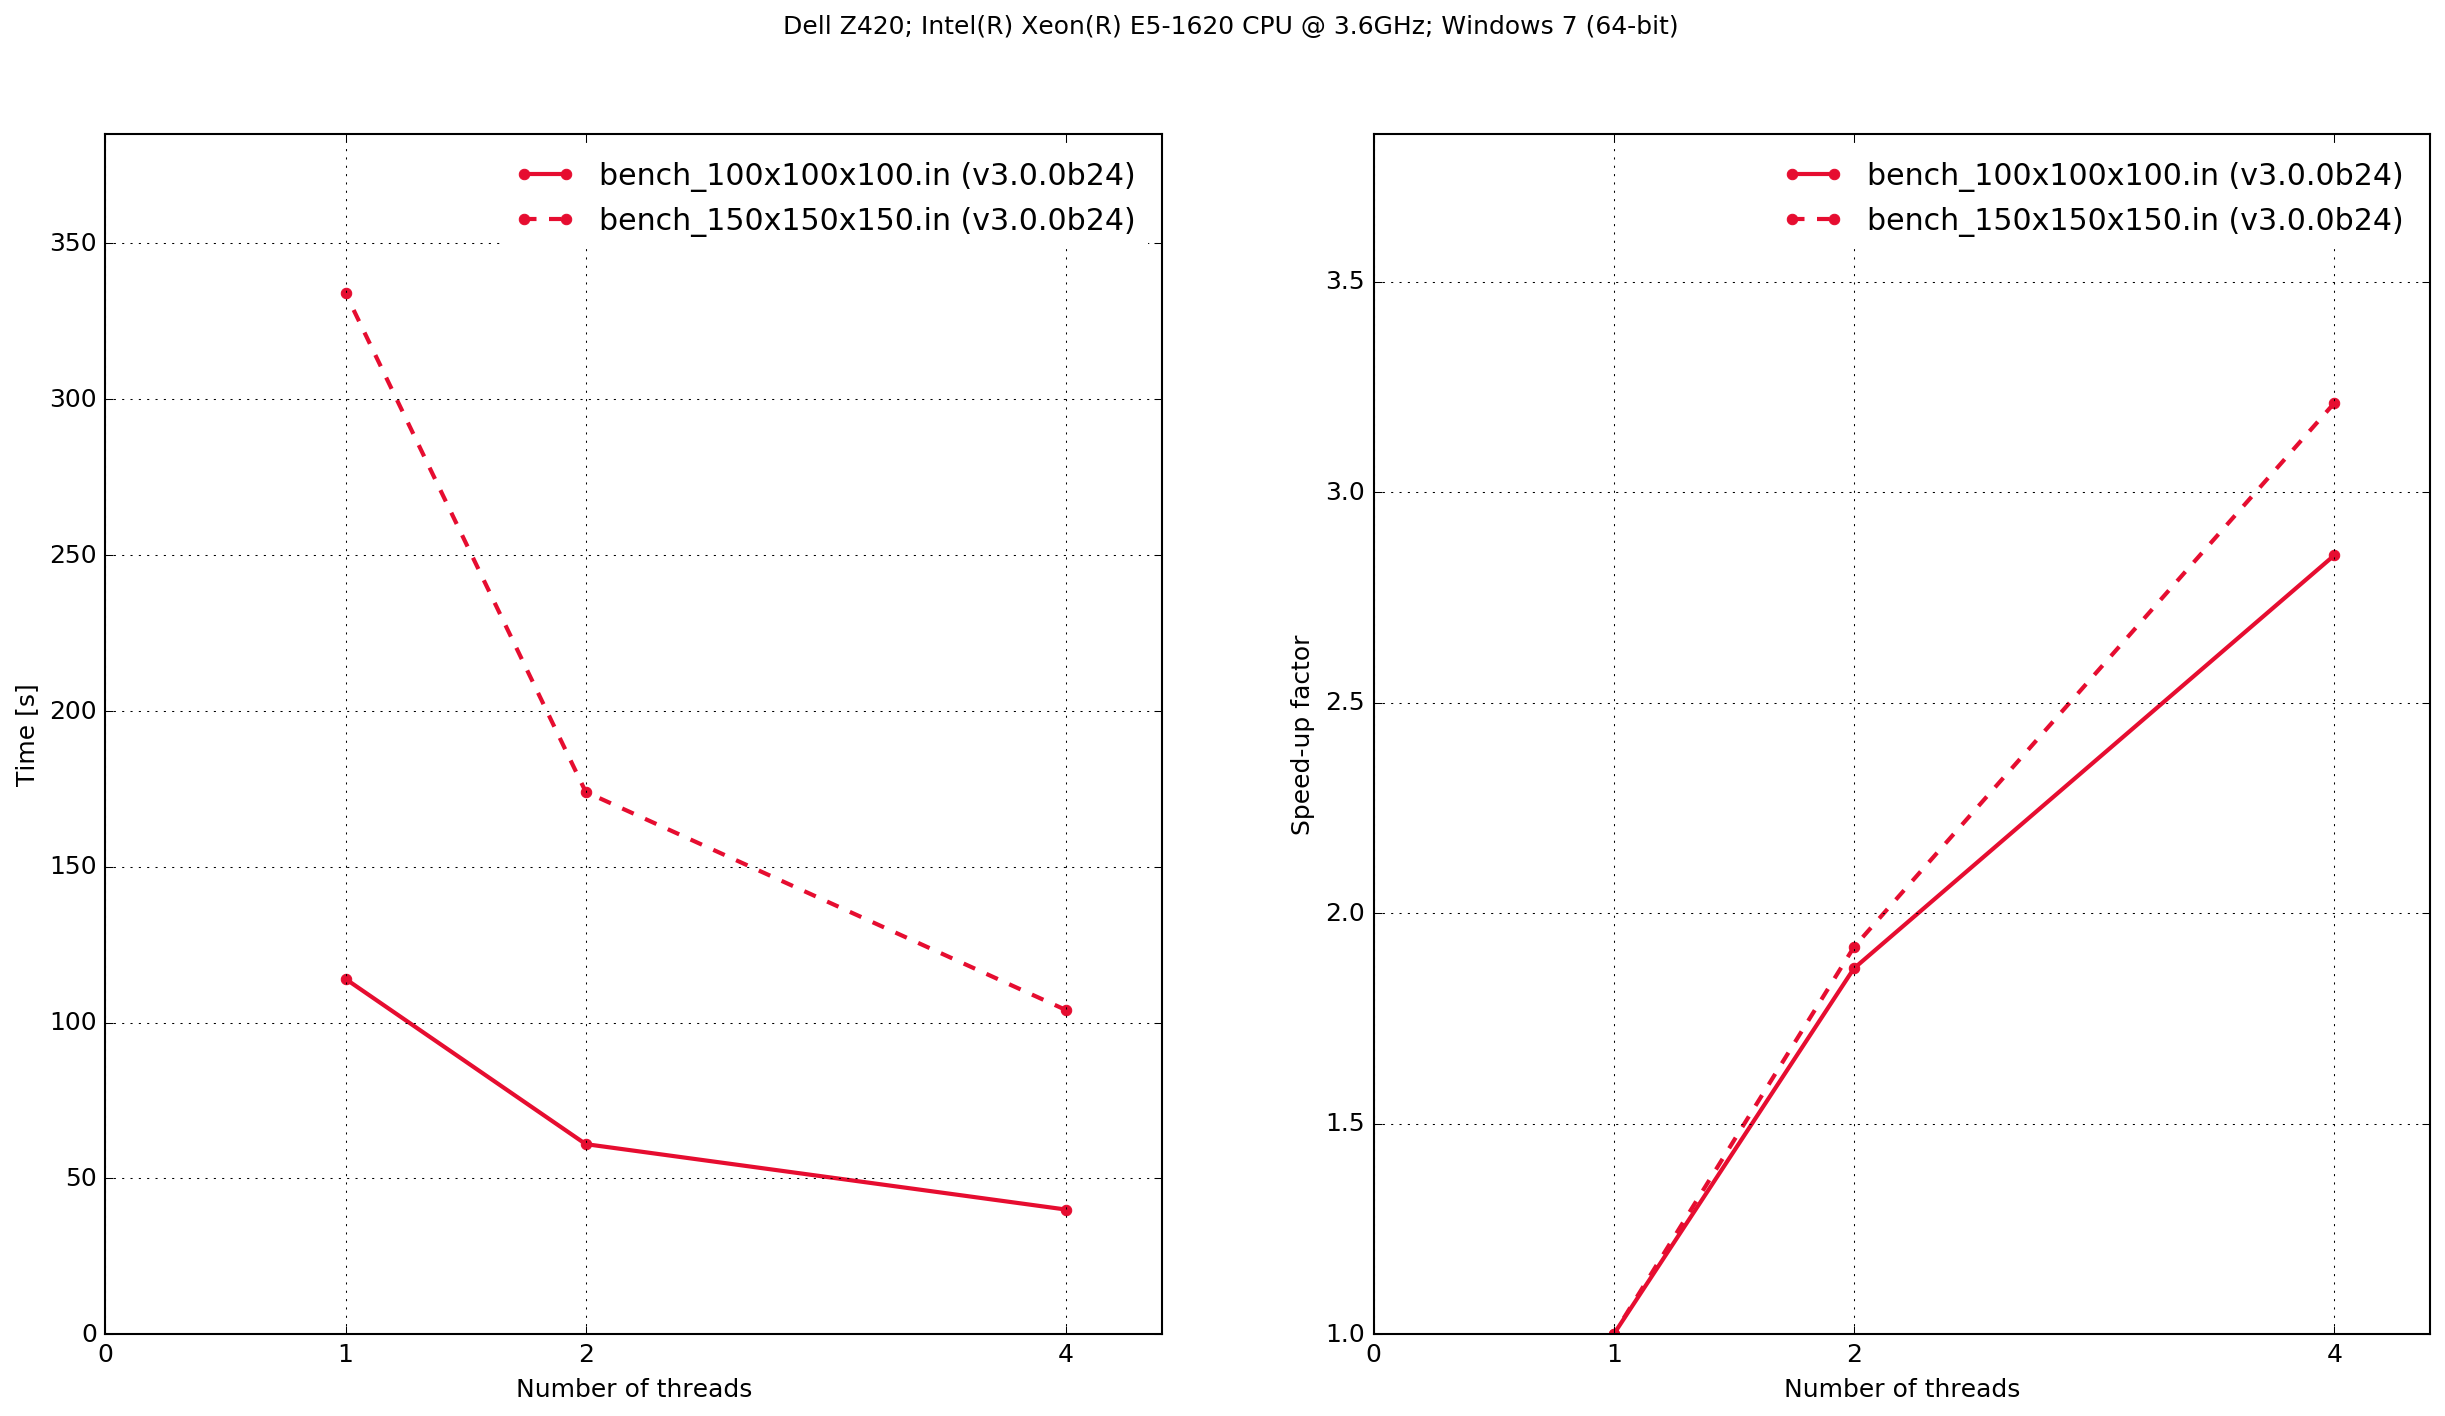
Dell Z420
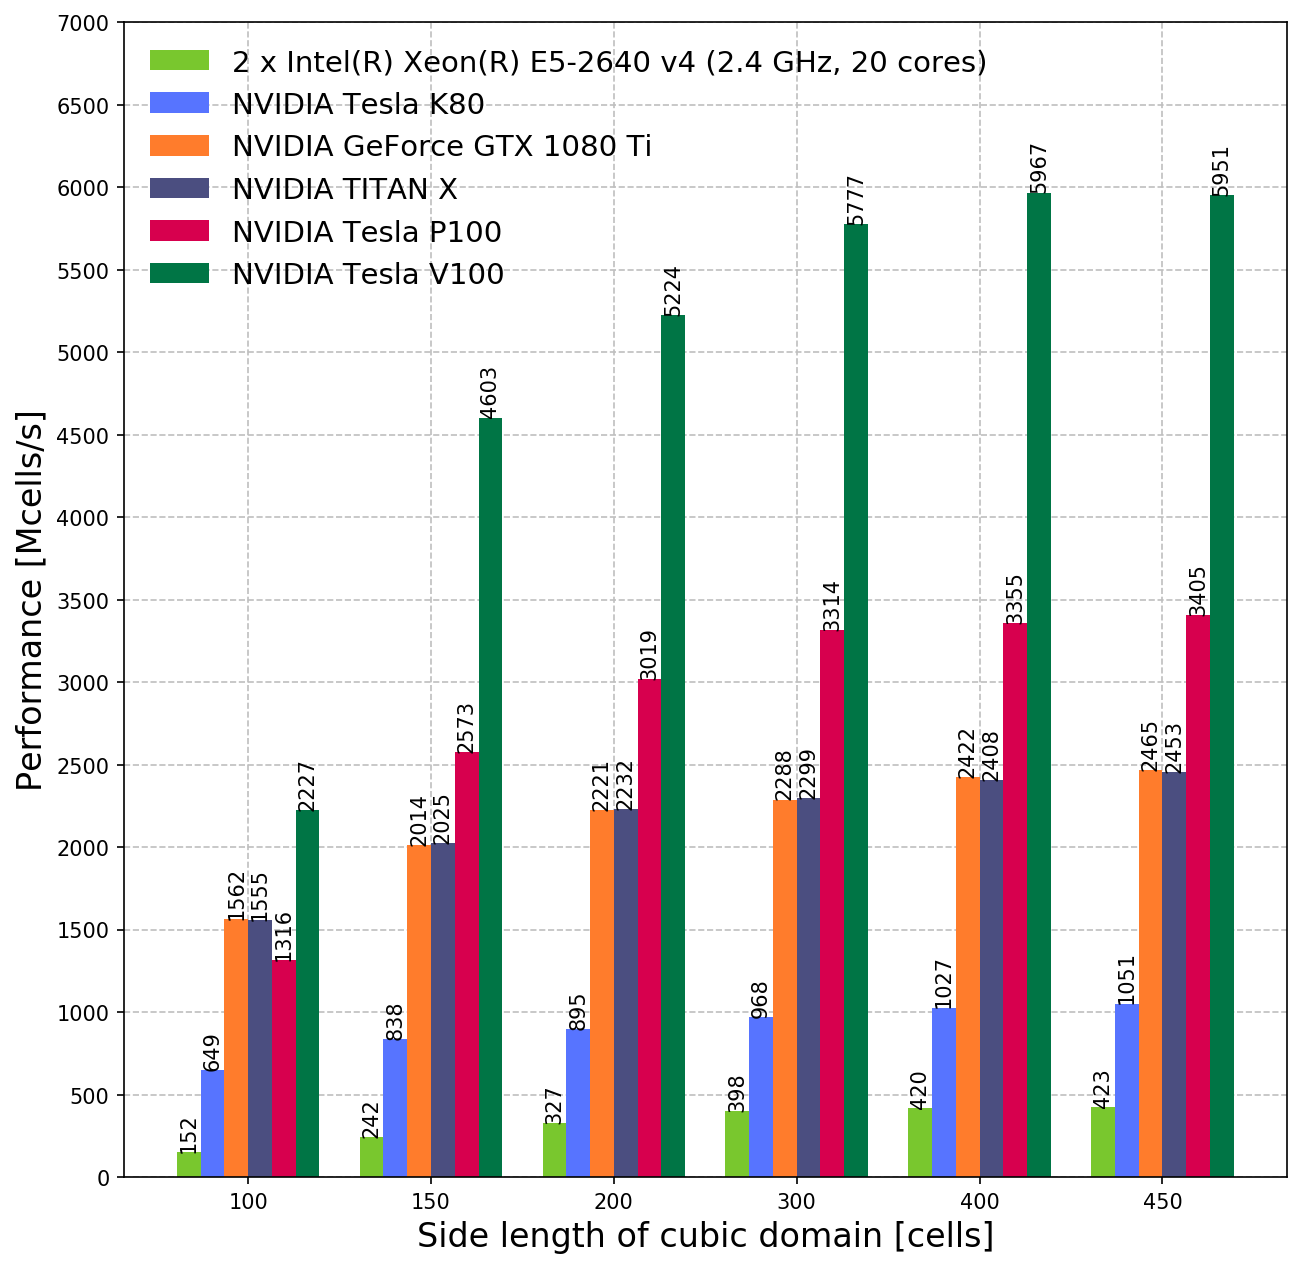
結果: GPU
NVIDIA GPUs
The performance metric used to measure the throughput of the solver is:
where P is the throughput in millions of cells per second; NX, NY, and NZ are the number of cells in domain in the x, y, and z directions; NT is the number of time-steps in the simulation; and T is the runtime of the simulation in seconds.